Introduction
Compare indicator shows the performance of multiple symbols on a line chart for the purpose of comparing those symbols performance based on their percentage change with each other.
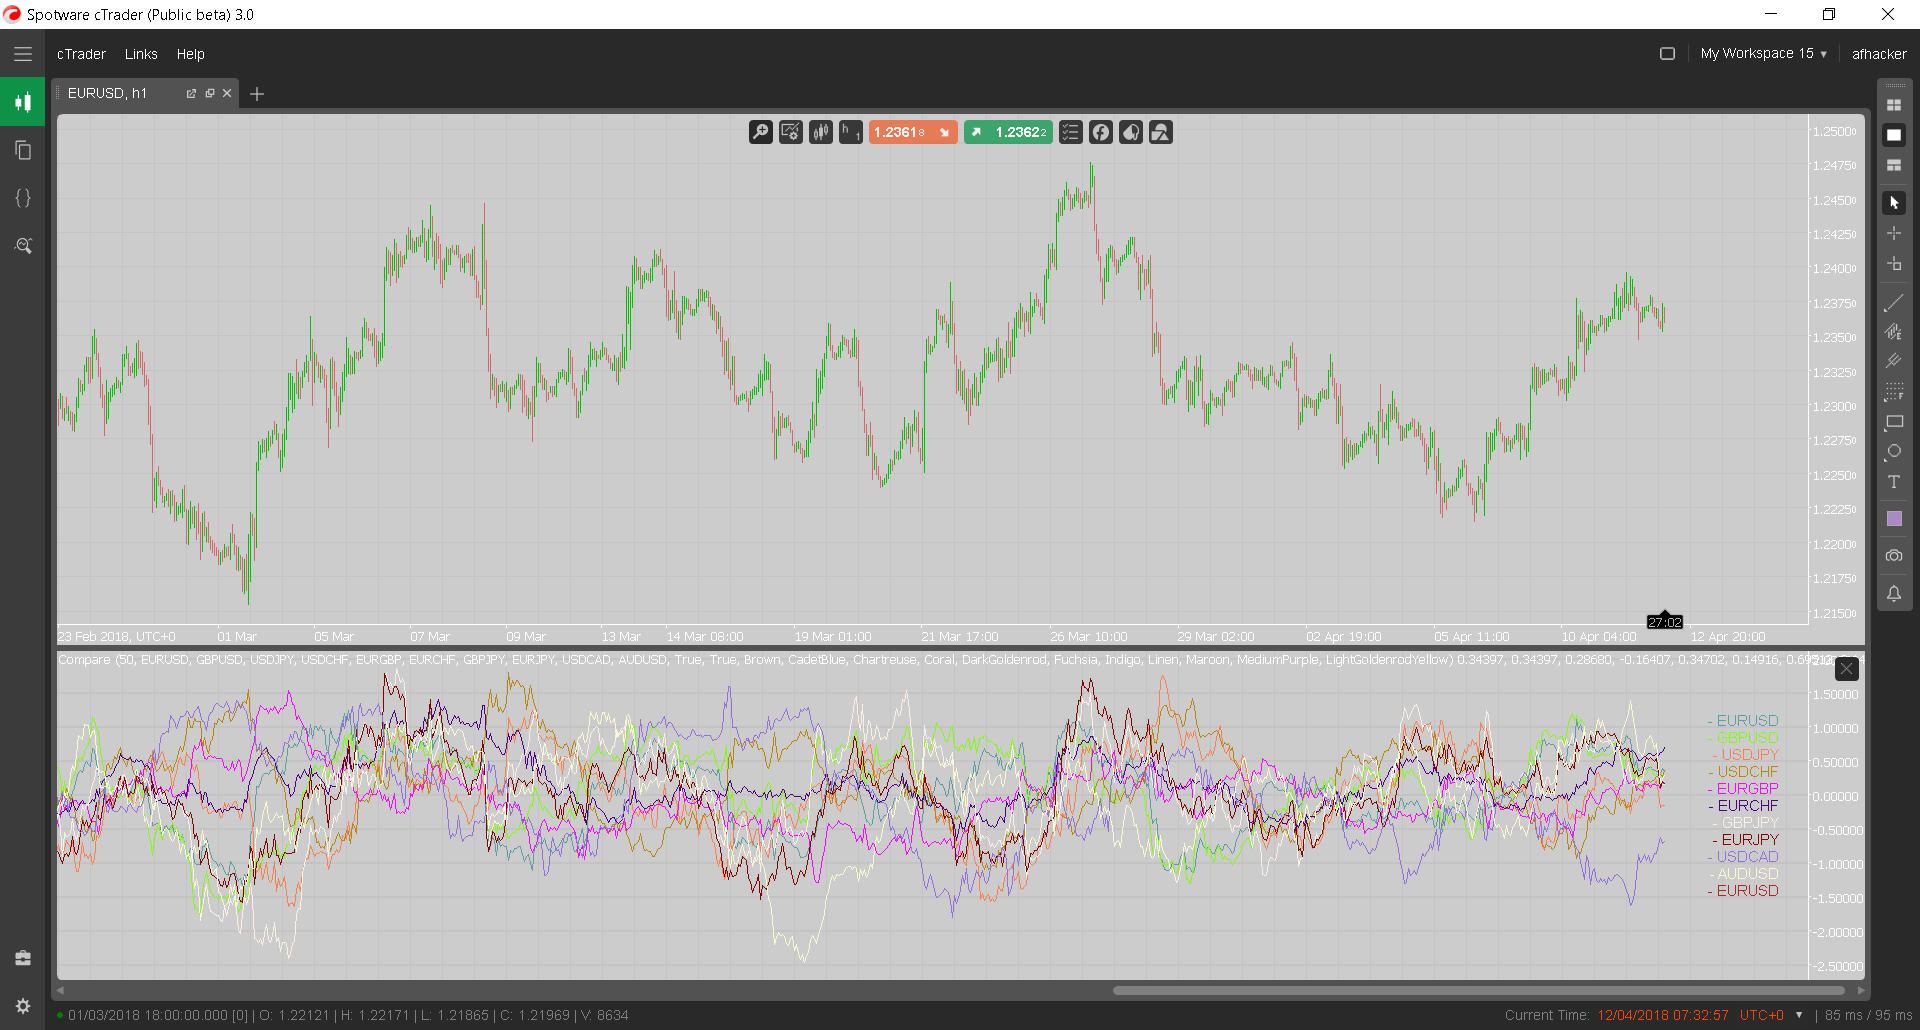
The chart values are in the amount of percentage changed of current bar compare to the previous bar.
Different Versions
The compare indicator came in three different versions:
- Compare Average: This version uses average percentage change of x previous bars
- Compare Per Bar: This version shows each bar percentage change in compare with the previous bar
- Compare Fixed Time: This version is similar to per bar version except you set the start and end time